Dashboards
Power BI
Sample
Retail Store Performance Report
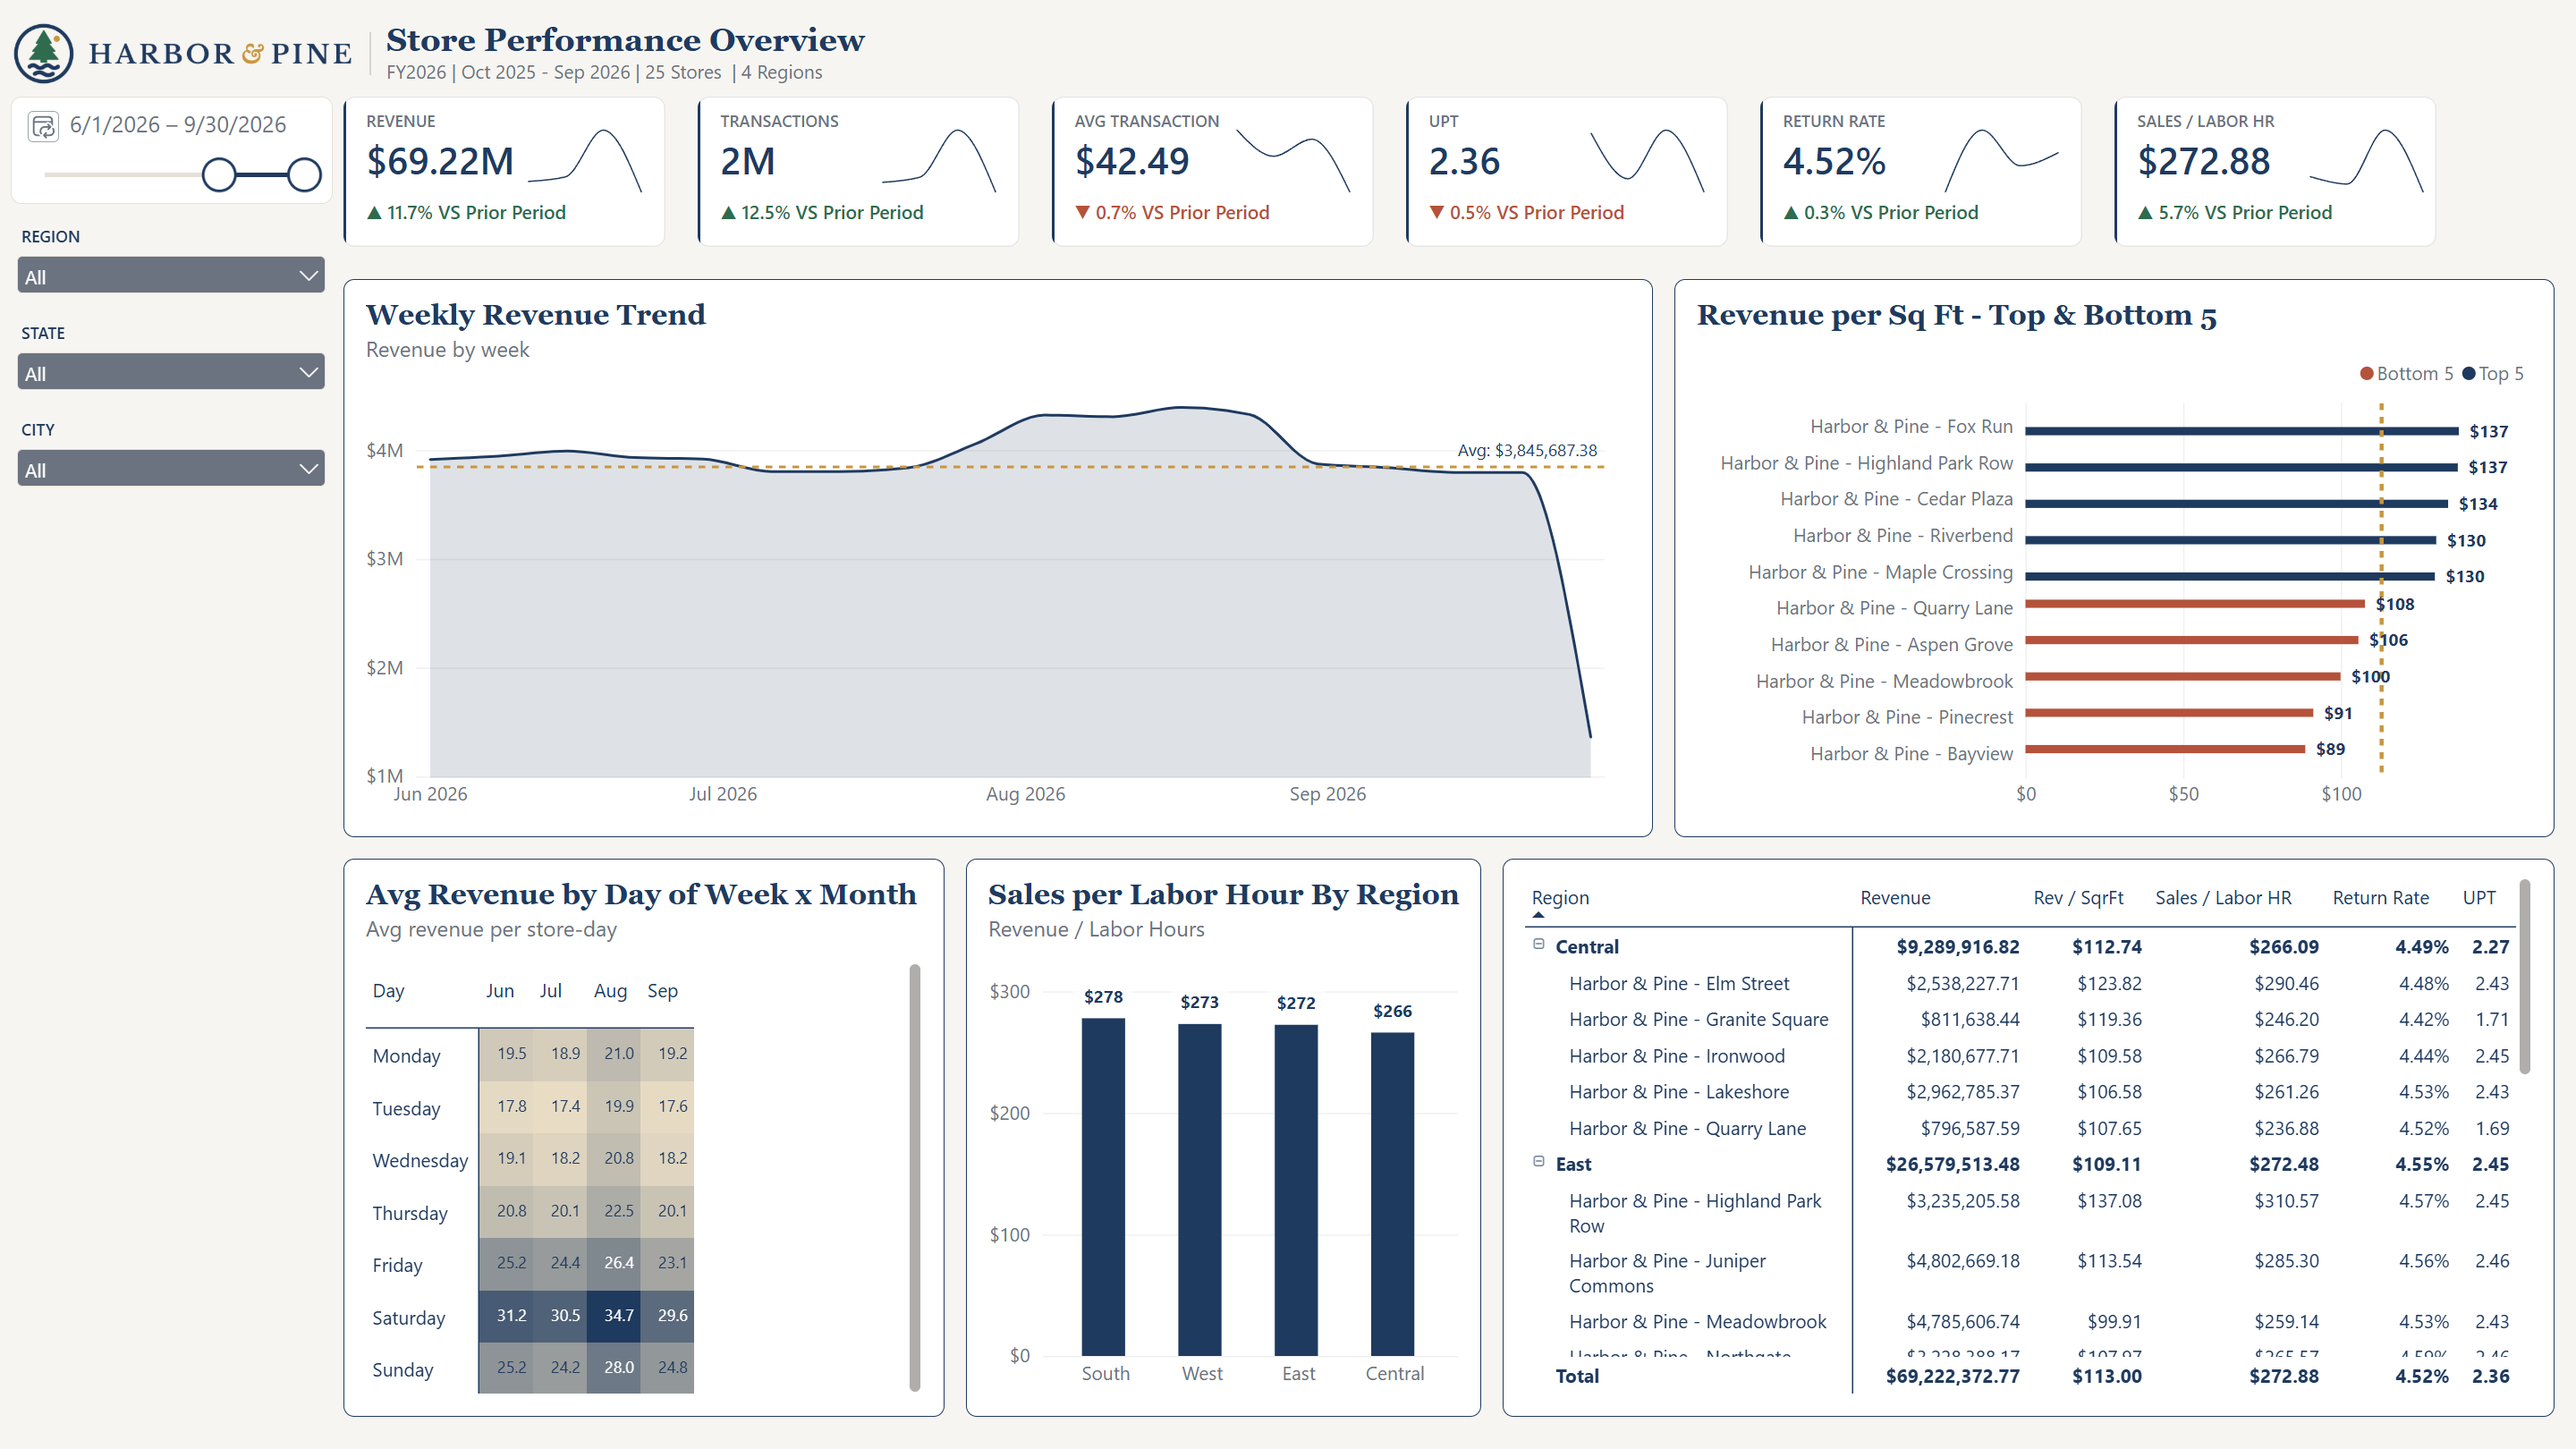
This is an executive dashboard for Harbor & Pine, a fictional 25-store home-goods retailer, synthetic company.
- Tool
- Power BI
- Category
- Dashboards
- Published
- Oct 2026
- Data
- Synthetic retail store daily sales (25 stores)
- Live view
- app.powerbi.com/vi…
 Recreated
Interactive view
Loads from Power BI when you click. Nothing is requested from Power BI before that.
About this dashboard
What it shows
Sample
Chain KPIs, weekly revenue trend, top/bottom stores by revenue per sq ft, peak-day heatmap, and a regional store scorecard.
KPI deltas compare against the prior period.
Audience
Sample
VP of Retail Operations and store/district managers
Refresh cadence
Sample
Static
Data
Sample
~8.7K store-day rows, Oct 2025 - Sep 2026